See
Recent data
for the latest data.
Today's
water temperature at 9am at
Knapp Mill |
 |
|
|
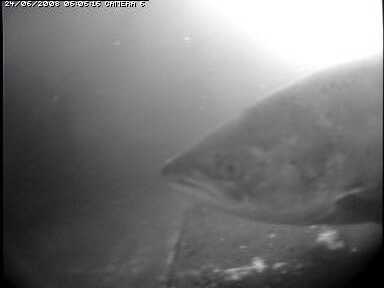
Click on images to view video. |
Click
on the video link below to see some side images of fish passing through
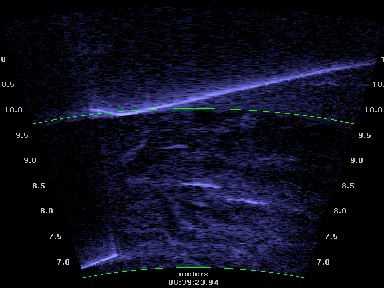
recently. Click on the Sonar image below to view DIDSON footage or follow
this DIDSON
link to view a summary report.
The
water temperature above is updated every morning at 9:00 am BST (08:00 GMT). View the
Temperature
page to see recent temperatures plotted daily. There is now a conversion
table at the bottom of this page for anyone preferring to work in Fahrenheit.
Flow data to
see the mean daily flows at Knapp Mill for this year compared with previous
years data.